Ni Sepharose High Performance
2024-11-27
Blood DNA MiniS Kit (Column Type)
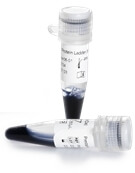
2024-12-0250bp DNA Ladder marker (5μl/T)
Product Number: DM09
Shipping and Storage
Long term storage at -20°C; 2-6°C can be stored for 3 months
Description
50bp DNA Ladder marker (5µl/T) is composed of 9 kinds of linear double stranded DNA, which is used as the reference of DNA relative molecular weight in agarose gel electrophoresis.
This product already contains 1×Loading Buffer and can be directly electrophoretic; The 9 types of bands are 500, 400, 350, 300, 250, 200, 150, 100, and 50bp respectively. The sample size is 5µl, 300bp is About 100ng, and the other bands are About 50ng each.
This product uses two electrophoretic indicator dyes, red and yellow, which will not leave a shadow on the gel and affect the color of EB. The migration distance of relative linear double stranded DNA in agarose gel electrophoresis is shown in Table 1.
Table 1:Agarose gel concentration and relative migration distance of dyes
| Gel concentration | Red Dye | Bromophenol blue* | Yellow Dye |
| 0.8% | 2,000bp | 600bp | About 80bp |
| 1.0% | 1,500bp | 400bp | About 40bp |
| 1.5% | 1,000bp | 300bp | About 20bp |
| 2.0% | 500bp | 200bp | <10bp |
| 2.5% | 350bp | 100bp | <10bp |
| 3.0% | 200bp | 80bp | <10bp |
*Bromophenol blue obscures the fluorescence of the covered DNA bands during EB coloration.
Prepare 6cm gel electrophoresis according to the concentration recommended in the instruction manual. The yellow dye reaches About 1cm at the front of the gel. Marker bands can be effectively separated, while ensuring adequate EB staining of small molecular weight DNA (refer to Note 4).
Voltage and electrophoresis time
Common gel lengths are 6cm (5.5cm from the sample hole to the front edge) and 11cm (10.5cm from the sample hole to the front edge). If the molecular weight of the DNA to be tested is greater than the minimum molecular weight of the Marker, the electrophoresis time can be determined by referring to Table 2.
Table 2:Time required for yellow dye electrophoresis to reach the front of gel About 1cm
| Electric field strength* | Front time of yellow dye reaching gel | |
| 6cm Gel | 11cm Gel | |
| 3 V/cm | About 52 min | About 110 min |
| 4 V/cm | About 42 min | About 80 min |
| 5 V/cm | About 32 min | About 70 min |
| 6 V/cm | About 25 min | About 55 min |
| 7.5 V/cm | About 18 min | About 38 min |
*The ratio of voltage to the distance between positive and negative electrodes.
Generally, gel with proper concentration is selected, and the voltage of 5 V/cm can be used to separate the various stripes of Marker, but the resolution is not enough. To accurately measure the molecular weight of DNA, the voltage should be reduced to 1 V/cm.
Roughly estimate the molecular weight and select the appropriate voltage as needed. For example, electrophoresis with a low voltage (such as 3V/cm) is used to reduce tailing when the pressure is>4000bp; If it is<1000bp, use a relatively high voltage (e.g. 7.5V/cm) to shorten the electrophoresis time, so as to avoid blurring of bands due to its rapid diffusion in gel.
Gel concentration selection
Table 3: Agarose gel concentration and linear double stranded DNA separation range
| Gel concentration | Linear double stranded DNA separation range |
| 0.5% | 1,000bp~30,000bp |
| 0.8% | 800bp~12,000bp |
| 1.0% | 500bp~10,000bp |
| 1.2% | 400bp~7,000bp |
| 1.5% | 200bp~3,000bp |
| 2.0% | 50bp~2,000bp |
Note
1.Use a buffer sol that is consistent with electrophoresis, such as using 1×TAE buffer electrophoresis requires the use of 1×TAE buffer sol.
2.Gel with concentration lower than 1.0% is easy to dehydrate, and "depression" in the middle affects electrophoresis. After gel is solidified, buffer solution can be added to cover gel.
3.After multiple electrophoresis, the conductivity of the buffer solution increases, and the current increases under the same voltage, resulting in lower resolution and obvious heat generation, which may cause gel melting or DNA denaturation in serious cases.
4.EB color rendering. EB can be added to agarose gel to the final concentration of 0.5μg/ml, and most EB is carried by small molecular weight DNA in a short time electrophoresis, which may make the color of large molecular weight DNA weaker; Long term electrophoresis may result in lighter color rendering of small molecular weight DNA due to EB moving towards the negative electrode. It is also possible to dye after electrophoresis and immerse the gel in an electrophoresis buffer containing 1μg/ml EB for 20-25minutes. Prolonged immersion will cause band dispersion due to the diffusion of DNA molecules, especially for small molecular weight DNA.
5.Under ultraviolet irradiation, EB is prone to decomposition, resulting in a lighter fluorescence of DNA bands. DNA is irradiated by ultraviolet light to form pyrimidine dimers, which is not conducive to downstream work of the fragments to be recovered; Therefore, minimize the UV irradiation time as much as possible.
6.Sucrose can bind to DNA, reducing its electrophoretic mobility. It is recommended to use a loading buffer containing glycerol.
7.Most nucleic acid tool enzymes bind to DNA, reducing its electrophoretic mobility, especially for high molecular weight DNA.


